Sentiments
Share of sentiments
See in the section results: Share of Sentiments.
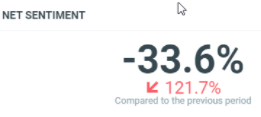
Net Sentiment
This diagram shows the net sentiment (result based only on positive and negative sentiment) for all documents which match the filter criterias:
To get this result, we can use the same API call as Share of Sentiments and apply this formula:
(#positive posts - #negative posts) / (#positive posts + #negative post)
In our sample: (255 - 513) / (255 + 513) = -258 / 768 = -0.3359375 = -33.6%
Sentiment over time
See in the section “results”: Results over time by Sentiments
Net Sentiment over time
This diagram shows the net sentiment on a specific date/time:
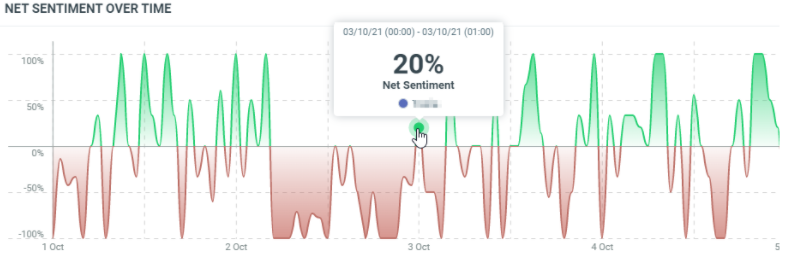
In our sample, the 3rd of October midnight, the net sentiment was 20%.
To get this result, we can use the same API call as Sentiment over time and apply this formula:
(#positive posts - #negative posts) / (#positive posts + #negative post)
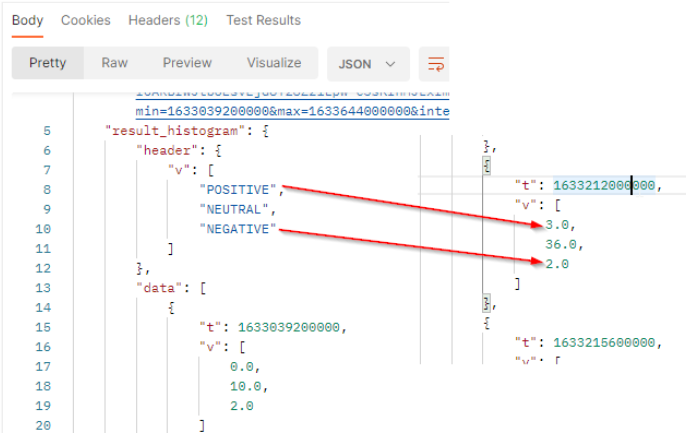
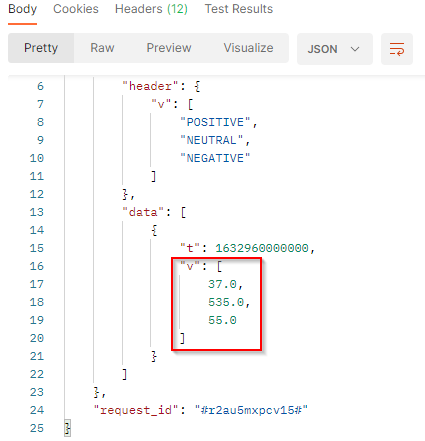
The result will come with a header row which provides the legend of the returned values. It’s always the 3 values POSITIVE, NEUTRAL and NEGATIVE. The order of the values respects the order of the header.
In our sample :
tis the timestamp (here 1633212000000 represents October 3, 2021 12:00:00 AM GMT+02:00).vis the results (number of documents) per sentiment. The Net sentiment value is: (3 - 2) / (3 + 2) = 1 / 5 = 0.2 = 20%
Sentiment key driver
This diagram shows the themes which drive your project with a sentiment score (X-absis):
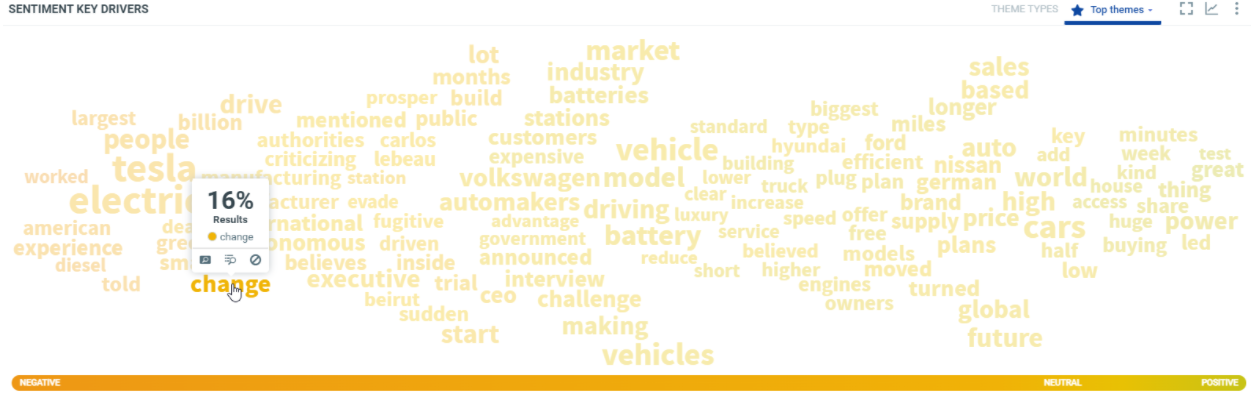
In this sample, over the filtered period (between the 1st of October and the 8th of october), we got the theme "change" was in 16% of the documents which match the project criterias. The sentiment score around this theme is between neutral and negative.
By API, it’s not possible to get it in one call. You need to make a call for each theme.
To get this result, you need to:
- To retrieve the list of themes which drive your project by using the
theme_cloudhistogram. - For each theme, call the
publishedhistogrambreakdown by sentimentwith the highestinterval valueto get only the total number over the period:
curl -L -X GET 'https://api.talkwalker.com/api/v1/search/p/<project_id>/histogram/published?access_token=<access_token>q=change&breakdown=sentiment&min=1633039200000&max=1633644000000&interval=2w'
To get only one result, the interval should be higher than the maximum engagement generated by 1 document which matches the criterias. In our sample, the maximum engagement is 35669 for one document, so we set the interval to 40000 to get only one result.
The result will come with a header row which provides the legend of the returned values. It’s always the 3 values POSITIVE, NEUTRAL and NEGATIVE. The order of the values respects the order of the header.
In our sample:
tis the timestamp (beginning of the period).vis the array of number of published documents which match the filter criterias (theme) in the filtered period. It comes as a list where each value represents one of the three sentiments. We got 37 + 535 + 55 = 627 documents with the theme "change". in the Results (or mentions) for the project, we go 3990 documents. In this case, the theme represents 627 / 3990 = 0.15714 = 16%. The sentiment score is mainly neutral and the net sentiment is negative.
Emotions over time
This diagram shows the total engagement generated by the documents which match your query on a specific date/time by emotion:
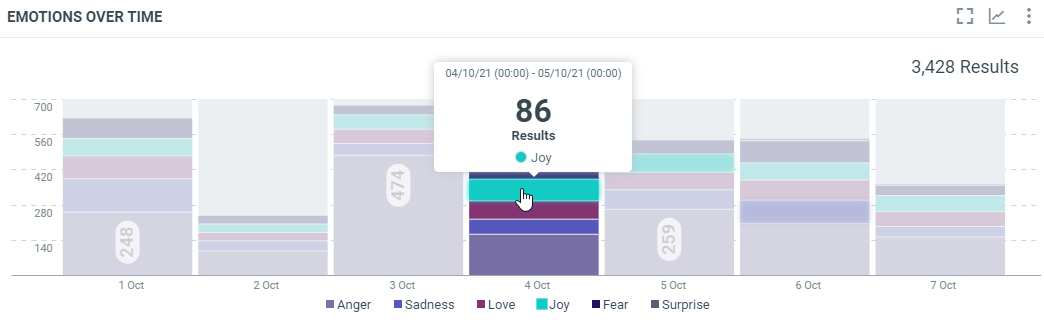
In this sample, the 04th of October, we have got 86 documents which were published with an emotion of joy.
By API, it’s not possible to get all metrics in one call.
To retrieve this result, we can combine the published histogram with the parameter q setted to the filter you want to retrieve. It can be one of these: emotionfilter-anger, emotionfilter-sadness, emotionfilter-fear, emotionfilter-love, emotionfilter-joy, emotionfilter-surprise.
curl -L -X GET 'https://api.talkwalker.com/api/v1/search/p/<project_id>/histogram/published?access_token=<access_token>&timezone=Europe/Luxembourg&min=1633039200000&max=1633644000000&interval=day&q=filter:emotionfilter-joy'
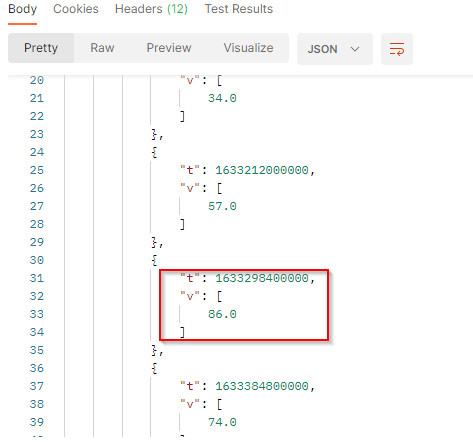
In our sample :
tis the timestamp (here 1633298400000 represents October 4, 2021 12:00:00 AM GMT+02:00).vis the number of documents which match the filter criterias at this date. we got 86 documents with an emotion of joy.
Share of emotions
This diagram shows the total engagement of the documents by media types within the filtered period:
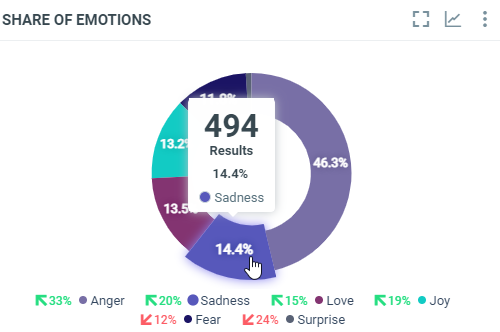
In this sample, over the filtered period (between the 1st of October and the 8th of october), we got 494 documents with an emotion of sadness, which represents 14.4% of the documents within the filtered period.
To retrieve this result, we can use the same call as Emotions over time, with the highest interval value to get only the total number over the period:
curl -L -X GET 'https://api.talkwalker.com/api/v1/search/p/<project_id>/histogram/published?access_token=<access_token>&timezone=Europe/Luxembourg&min=1633039200000&max=1633644000000&interval=2w&q=filter:emotionfilter-sadness'
If the data is spread over 2 weeks, months, quarter or years, you will get 2 results, one per period. You need to double it to get only one result (eg: if it spreads over 2 years, use the interval 720d).
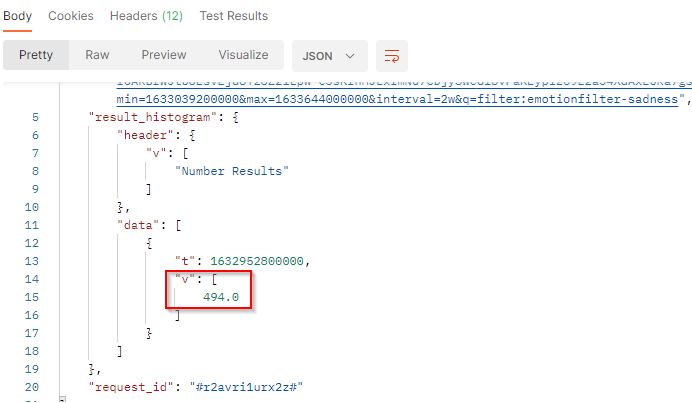
In our sample :
tis the timestamp (beginning of the period).vis the number of published documents which match the filter criterias in the filtered period. we got 494 documents with an emotion of sadness in the period.