Performances
Results (or mentions)
This diagram shows the total number of documents which match the criterias within the filtered period:
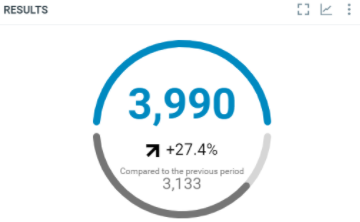
In this sample, over the filtered period (between the 1st of October and the 8th of october), we got 3990 documents which match the project criterias.
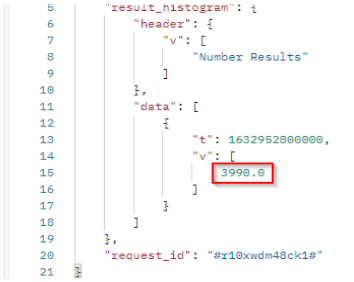
To retrieve this result, we can use published histogram with the highest interval value to get only the total number over the period:
curl -L -X GET 'https://api.talkwalker.com/api/v1/search/p/<project_id>/histogram/published?access_token=<access_token>&interval=2w&timezone=Europe/Luxembourg&min=1633039200000&max=1633644000000'
In our sample :
tis the timestamp (beginning of the period).vis the number of published documents which match the filter criterias in the filtered period. we got 3990 documents in the period.
Engagement
This diagram shows the total number of engagement generated by the documents which match the criterias within the filtered period:
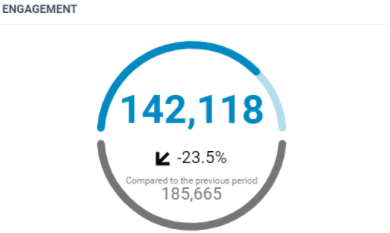
In this sample, over the filtered period (between the 1st of October and the 8th of october), we got a total engagement of 142118 in the documents which match the project criterias.
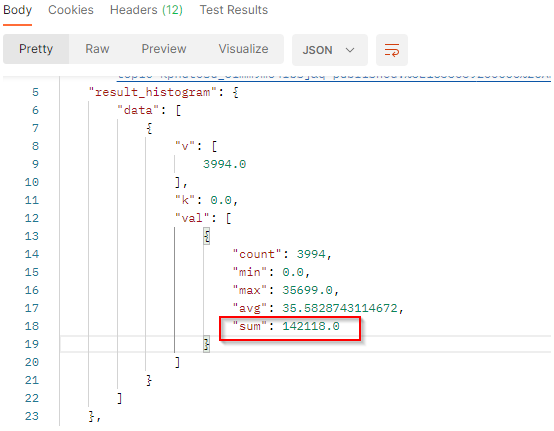
To retrieve this result, we can use engagement histogram with the highest interval value to get only the total number over the period:
curl -L -X GET 'https://api.talkwalker.com/api/v1/search/p/<project_id>/histogram/engagement?access_token=<access_token>&q=published:>1633039200000 AND published:<1633644000000&interval=400000'
To get only one result, the interval should be higher than the maximum engagement generated by 1 document which matches the criterias. In our sample, the maximum engagement is 35669 for one document, so we set the interval to 40000 to get only one result.
In our sample :
vis the number of documents which match the filter criterias in the filtered period. we got 3994 documents in the period.kis the number-based lower bound of the current bucket. The buchet bounds depend on the interval.valcontains the value to build histogram:
countis the number of documents which match the filter criterias in the interval. It corresponds to the results.minis the minimum engagement generated by the documents which match the filter criterias in the interval.maxis the maximum engagement generated by the documents which match the filter criterias in the interval.avgis the average of engagement generated by the documents which match the filter criterias in the interval. It’s the sum / count.sumis the total engagement generated by the documents which match the filter criterias in the interval. In this resultset, we got a total engagement of 142,118.
Engagement over time
Global usage without comparison
This diagram shows the total engagement generated by the documents which match your query on a specific date/time:
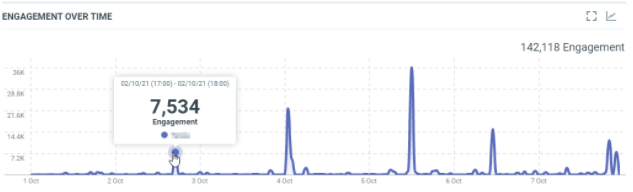
In this sample, the 2nd of October, 17h (Europe/Luxembourg time zone), we have a total engagement of 7534 generated by the documents which were published.
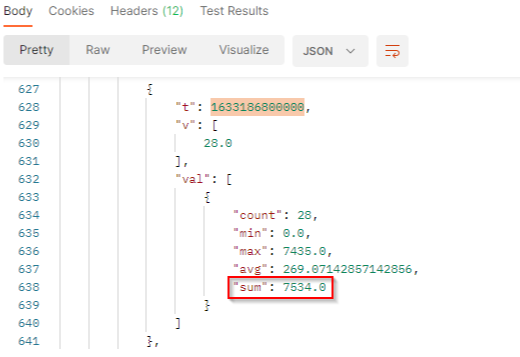
To retrieve this result, we can combine the published histogram with the parameter value_type engagement:
curl -L -X GET 'https://api.talkwalker.com/api/v1/search/p/<project_id>/histogram/published?access_token=<access_token>&value_type=engagement&timezone=Europe/Luxembourg&min=1633039200000&max=1633644000000&interval=hour'
In our sample :
tis the timestamp (here 1633186800000 represents October 2, 2021 05:00:00 PM GMT+02:00).vis the number of documents which match the filter criterias at this date.valcontains the value to build histogram:
countis the number of documents which match the filter criterias at this date. It corresponds to the results.minis the minimum engagement generated by the documents which match the filter criterias at this date.maxis the maximum engagement generated by the documents which match the filter criterias at this date.avgis the average of engagement generated by the documents which match the filter criterias at this date. It’s the sum / count.sumis the total engagement generated by the documents which match the filter criterias at this date. At this date, we got a total engagement of 7534.
Engagement over time by Media types
This diagram shows the total engagement generated by the documents which match your query on a specific date/time splitted by media types:
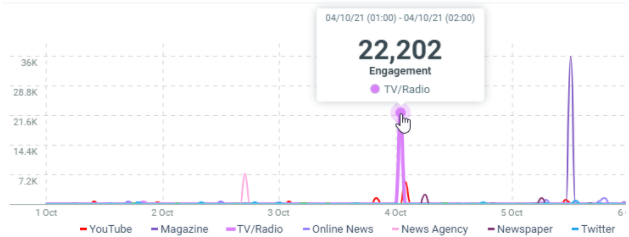
In this sample, the 4th of October at 01h (Europe/Luxembourg time zone), we got a total engagement of 22202 in the TV/Radia documents which match the project criterias.
To retrieve this result, we can use the same endpoint as the histogram Engagement over time with the additional parameter breakdown:
curl -L -X GET 'https://api.talkwalker.com/api/v1/search/p/<project_id>/histogram/published?access_token=<access_token>&value_type=engagement&timezone=Europe/Luxembourg&breakdown=sourcetype&min=1633039200000&max=1633644000000&interval=hour'
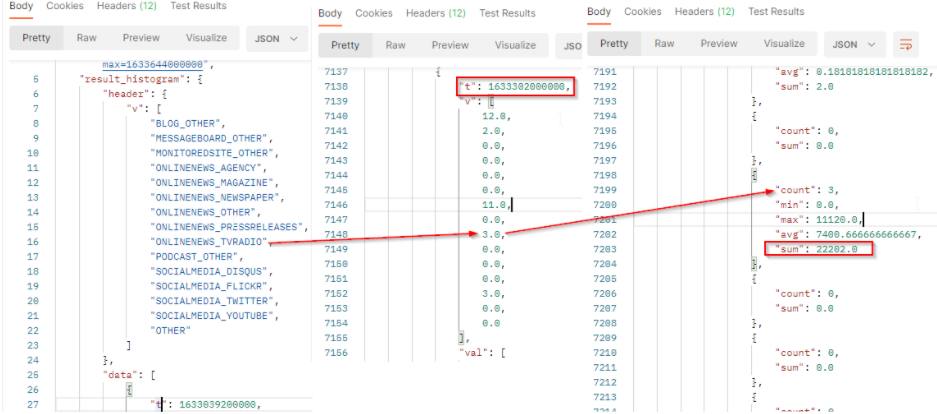
The result will come with a header row which provides the legend of the returned values. The order of the values respects the order of the header.
The result is a bidimensional array where v is the results (number of documents) per Media type and val contains engagement values to build the histogram.
In our sample :
tis the timestamp (here 1633302000000 represents October 4, 2021 01:00:00 AM GMT+02:00).vis the number of documents which match the filter criterias at this date.valcontains the value to build histogram:
countis the number of documents which match the filter criterias at this date. It corresponds to the results.minis the minimum engagement generated by the documents which match the filter criterias at this date.maxis the maximum engagement generated by the documents which match the filter criterias at this date.avgis the average of engagement generated by the documents which match the filter criterias at this date. It’s the sum / count.sumis the total engagement generated by the documents which match the filter criterias at this date. At this date, we got a total engagement of 22202 for TV/Radio documents.
Engagement over time by Sentiments
This diagram shows the total engagement generated by the documents which match your query on a specific date/time splitted by sentiments:
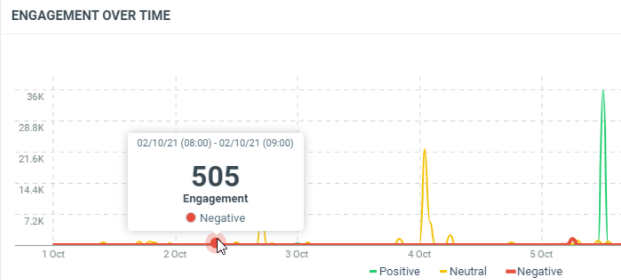
In this sample, the 2nd of October at 08h (Europe/Luxembourg time zone), we got a total engagement of 505 for documents with a negative sentiment which match the project criterias.
To retrieve this result, we can use the same endpoint as the histogram Engagement over time with the additional parameter breakdown:
curl -L -X GET 'https://api.talkwalker.com/api/v1/search/p/<project_id>/histogram/published?access_token=<access_token>&value_type=engagement&timezone=Europe/Luxembourg&breakdown=sentiment&min=1633039200000&max=1633644000000&interval=hour'
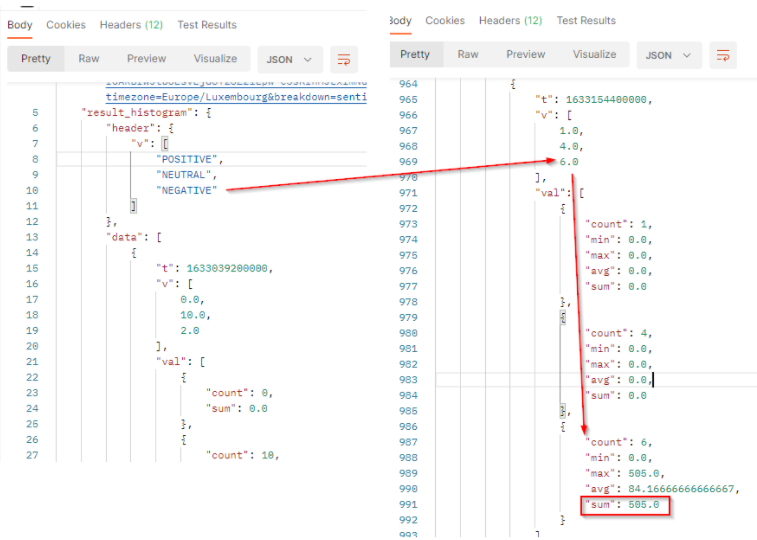
The result will come with a header row which provides the legend of the returned values. It’s always the 3 values POSITIVE, NEUTRAL and NEGATIVE. The order of the values respects the order of the header.
The result is a bidimensional array where v is the results (number of documents) per sentiment and val contains engagement values to build the histogram.
In our sample :
tis the timestamp (here 1633154400000 represents October 2, 2021 08:00:00 AM GMT+02:00).vis the number of documents which match the filter criterias at this date.valcontains the value to build histogram:
countis the number of documents which match the filter criterias and sentiment at this date. It corresponds to the results.minis the minimum engagement generated by the documents which match the filter criterias and sentiment at this date.maxis the maximum engagement generated by the documents which match the filter criterias and sentiment at this date.avgis the average of engagement generated by the documents which match the filter criterias and sentiment at this date. It’s the sum / count.sumis the total engagement generated by the documents which match the filter criterias and sentiment at this date. At this date, we got a total engagement of 505 for documents with a negative sentiment.
Engagement over time by Countries
This diagram shows the total engagement generated by the documents which match your query on a specific date/time splitted by countries:
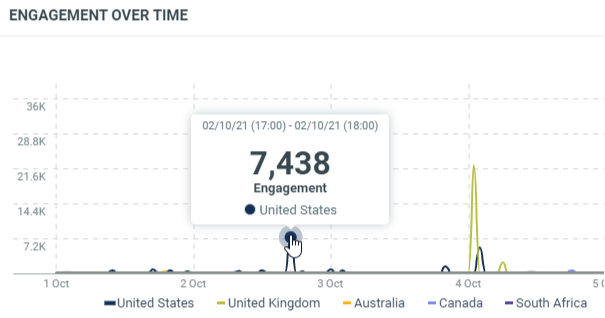
In this sample, the 2nd of October at 17h (Europe/Luxembourg time zone), we got a total engagement of 7438 for documents from the USA which match the project criterias.
To retrieve this result, we can use the same endpoint as the histogram Engagement over time with the additional parameter breakdown:
curl -L -X GET 'https://api.talkwalker.com/api/v1/search/p/<project_id>/histogram/published?access_token=<access_token>&value_type=engagement&timezone=Europe/Luxembourg&breakdown=country&min=1633039200000&max=1633644000000&interval=hour'
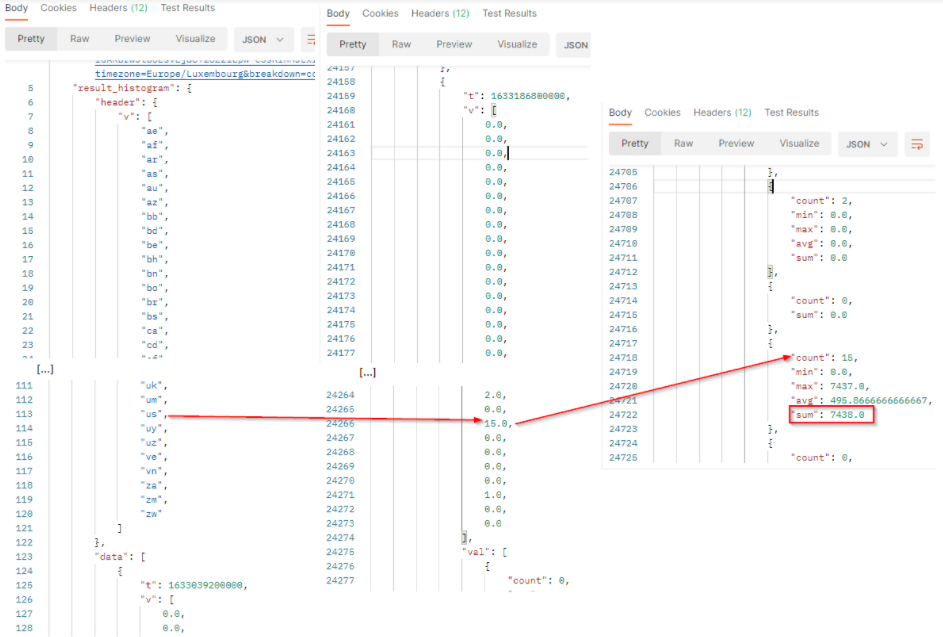
The result will come with a header row which provides the country codes of the returned values. The order of the values respects the order of the header.
The result is a bidimensional array where v is the results (number of documents) per country code and val contains engagement values to build the histogram.
In our sample :
tis the timestamp (here 1633186800000 represents October 2, 2021 05:00:00 PM GMT+02:00).vis the number of documents which match the filter criterias at this date.valcontains the value to build histogram:
countis the number of documents from the country which match the filter criterias at this date. It corresponds to the results.minis the minimum engagement generated by the documents from the country which match the filter criterias at this date.maxis the maximum engagement generated by the documents from the country which match the filter criterias at this date.avgis the average of engagement generated by the documents from the country which match the filter criterias at this date. It’s the sum / count.sumis the total engagement generated by the documents from the country which match the filter criterias at this date. At this date, we got a total engagement of 7438 for documents from the USA (country code “us”).
Potential reach
This diagram shows the total number of people that were reached by the documents which match the criterias within the filtered period:
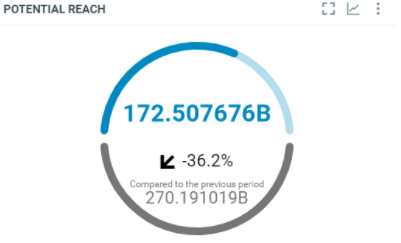
In this sample, over the filtered period (between the 1st of October and the 8th of october), we got 172.507676 Billions persons reached by the documents which match the project criterias.
To retrieve this result, we can use reach histogram with the highest interval value to get only the total number over the period:
curl -L -X GET 'https://api.talkwalker.com/api/v1/search/p/<project_id>/histogram/reach?access_token=<access_tokrn>&q=published:>1633039200000 AND published:<1633644000000&interval=1200000000'
To get only one result, the interval should be higher than the maximum potential reach generated by 1 document which matches the criterias. In our sample, the maximum potential reach is 1,141,928,704 for one document, so we set the interval to 1,200,000,000 to get only one result.
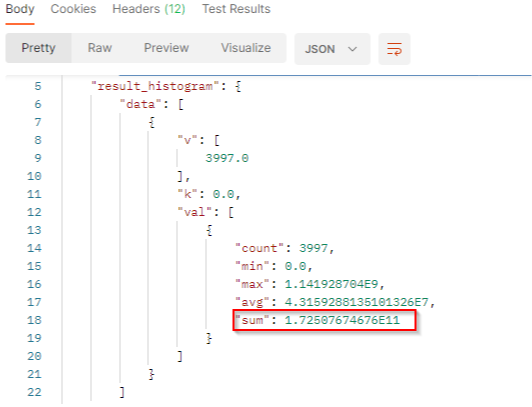
In our sample :
vis the number of documents which match the filter criterias in the filtered period. we got 3997 documents in the period.kis the number-based lower bound of the current bucket. The buchet bounds depend on the interval.valcontains the value to build histogram:
countis the number of documents which match the filter criterias in the interval. It corresponds to the results.minis the minimum potential reach generated by the documents which match the filter criterias in the interval.maxis the maximum potential reach generated by the documents which match the filter criterias in the interval.avgis the average potential reach generated by the documents which match the filter criterias in the interval. It’s the sum / count.sumis the total engagement generated by the documents which match the filter criterias in the interval. In this resultset, we got a total potential reach of 172,507,674,676.
Potential reach over time
Global usage without comparison
This diagram shows the potential reach generated by the documents which match your query on a specific date/time:
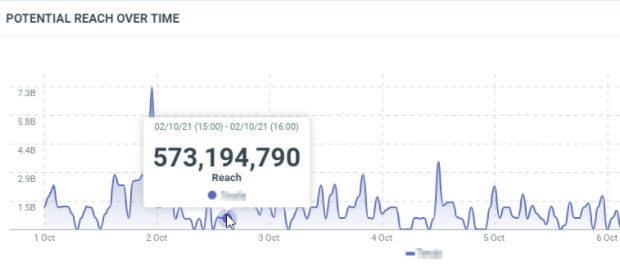
In this sample, the 2nd of October, 15h (Europe/Luxembourg time zone), the published documents potentially reach 573,174,790 people.
To retrieve this result, we can combine the published histogram with the parameter value_type reach:
curl -L -X GET 'https://api.talkwalker.com/api/v1/search/p/<project_id>/histogram/published?access_token=<access_token>&value_type=reach&timezone=Europe/Luxembourg&min=1633039200000&max=1633644000000&interval=hour'
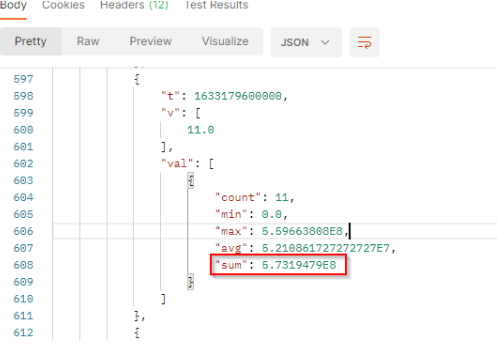
In our sample :
tis the timestamp (here 1633179600000 represents October 2, 2021 03:00:00 PM GMT+02:00).vis the number of documents which match the filter criterias at this date.valcontains the value to build histogram:
countis the number of documents which match the filter criterias at this date. It corresponds to the results.minis the minimum potential reach generated by the documents which match the filter criterias at this date.maxis the maximum potential reach generated by the documents which match the filter criterias at this date.avgis the average of potential reach generated by the documents which match the filter criterias at this date. It’s the sum / count.sumis the total potential reach generated by the documents which match the filter criterias at this date. At this date, we got a total engagement of 573,194,790.
Potential reach over time by Media Types
This diagram shows the potential reach generated by the documents which match your query on a specific date/time splitted by Media types:
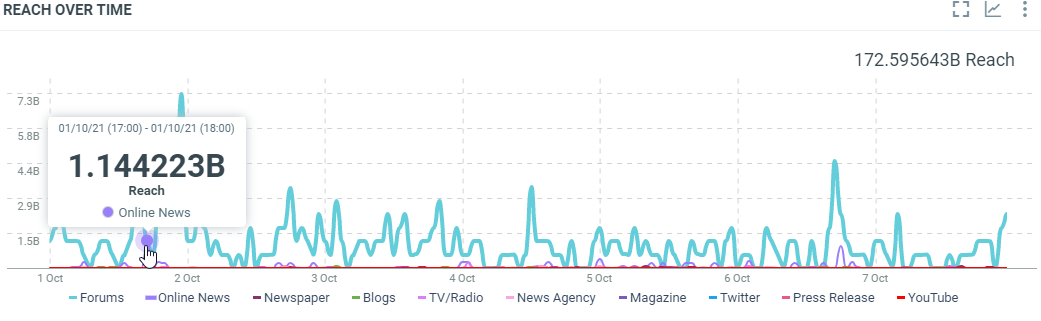
In this sample, the 1st of October, 17h (Europe/Luxembourg time zone), the published documents potentially reach 1.144223 Billion of people.
To retrieve this result, we can use the same endpoint as the histogram Potential reach over time with the additional parameter breakdown:
curl -L -X GET 'https://api.talkwalker.com/api/v1/search/p/<project_id>/histogram/published?access_token=<access_token>&value_type=reach&timezone=Europe/Luxembourg&interval=hour&min=1633039200000&max=1633644000000&breakdown=sourcetype'
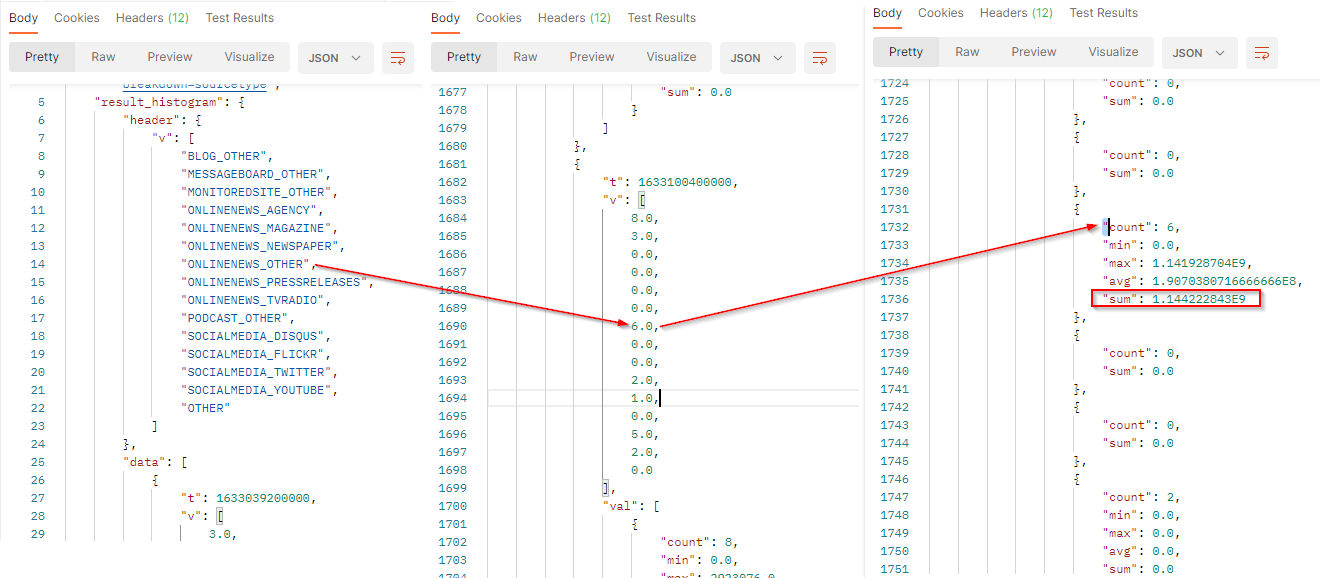
The result will come with a header row which provides the legend of the returned values. The order of the values respects the order of the header.
The result is a bidimensional array where v is the results (number of documents) per Media type and val contains potential reach values to build the histogram.
In our sample :
tis the timestamp (here 1633100400000 represents October 1, 2021 05:00:00 PM GMT+02:00).vis the number of documents which match the filter criterias at this date.valcontains the value to build histogram:
countis the number of documents which match the filter criterias at this date. It corresponds to the results.minis the minimum potential reach generated by the documents which match the filter criterias at this date.maxis the maximum potential reach generated by the documents which match the filter criterias at this date.avgis the average of potential reach generated by the documents which match the filter criterias at this date. It’s the sum / count.sumis the total potential reach generated by the documents which match the filter criterias at this date. At this date, published documents potentially reach 1.144222843 Billion peoples.
Potential reach over time by Sentiments
This diagram shows the potential reach generated by the documents which match your query on a specific date/time splitted by Sentiments:
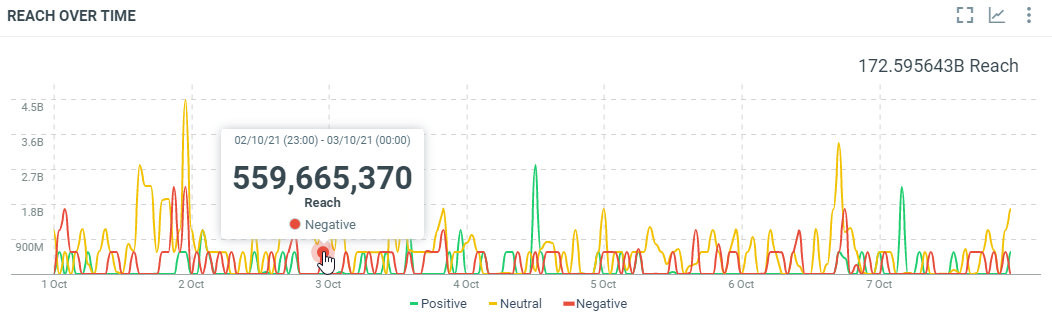
In this sample, the 2nd of October, 23h (Europe/Luxembourg time zone), the published documents with a negative sentiment potentially reach 559,665,370 peoples.
To retrieve this result, we can use the same endpoint as the histogram Potential reach over time with the additional parameter breakdown:
curl -L -X GET 'https://api.talkwalker.com/api/v1/search/p/<project_id>/histogram/published?access_token=<access_token>&value_type=reach&timezone=Europe/Luxembourg&interval=hour&min=1633039200000&max=1633644000000&breakdown=sentiment'
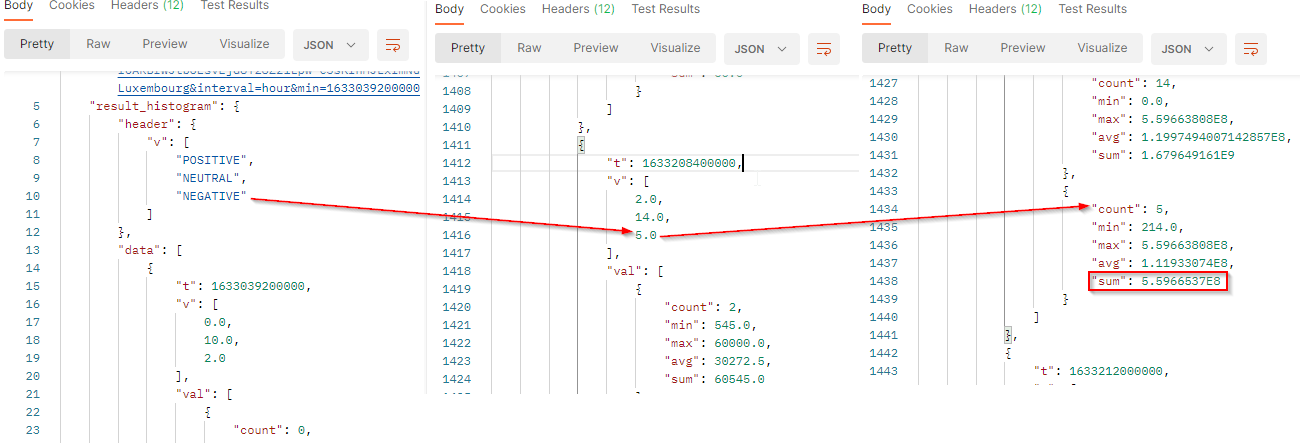
The result will come with a header row which provides the legend of the returned values. It’s always the 3 values POSITIVE, NEUTRAL and NEGATIVE. The order of the values respects the order of the header.
The result is a bidimensional array where v is the results (number of documents) per sentiment and val contains engagement values to build the histogram.
In our sample :
tis the timestamp (here 1633208400000 represents October 2, 2021 11:00:00 PM GMT+02:00).vis the number of documents which match the filter criterias at this date.valcontains the value to build histogram:
countis the number of documents which match the filter criterias at this date. It corresponds to the results.minis the minimum potential reach generated by the documents which match the filter criterias at this date.maxis the maximum potential reach generated by the documents which match the filter criterias at this date.avgis the average of potential reach generated by the documents which match the filter criterias at this date. It’s the sum / count.sumis the total potential reach generated by the documents which match the filter criterias at this date. At this date, published documents with a negative sentiment potentially reach 559,665,370 peoples.
Potential reach over time by Countries
This diagram shows the potential reach generated by the documents which match your query on a specific date/time splitted by Countries:
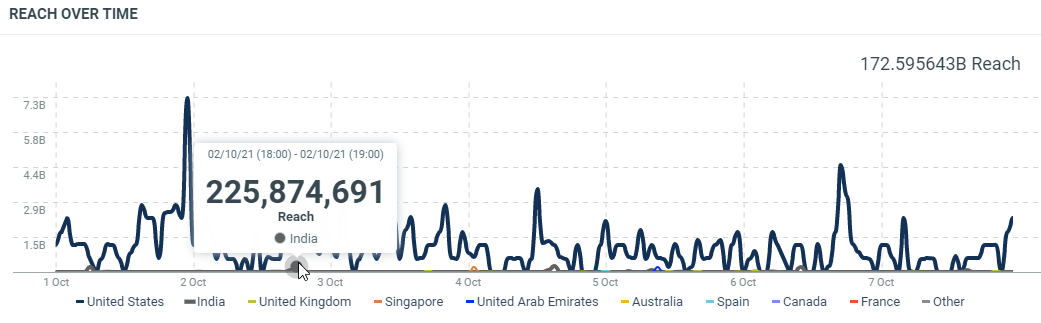
In this sample, the 2nd of October, 18h (Europe/Luxembourg time zone), the published documents friom India potentially reach 225,874,691 peoples.
To retrieve this result, we can use the same endpoint as the histogram Potential reach over time with the additional parameter breakdown:
curl -L -X GET 'https://api.talkwalker.com/api/v1/search/p/<project_id>/histogram/published?access_token=<access_token>&value_type=reach&timezone=Europe/Luxembourg&interval=hour&min=1633039200000&max=1633644000000&breakdown=country'
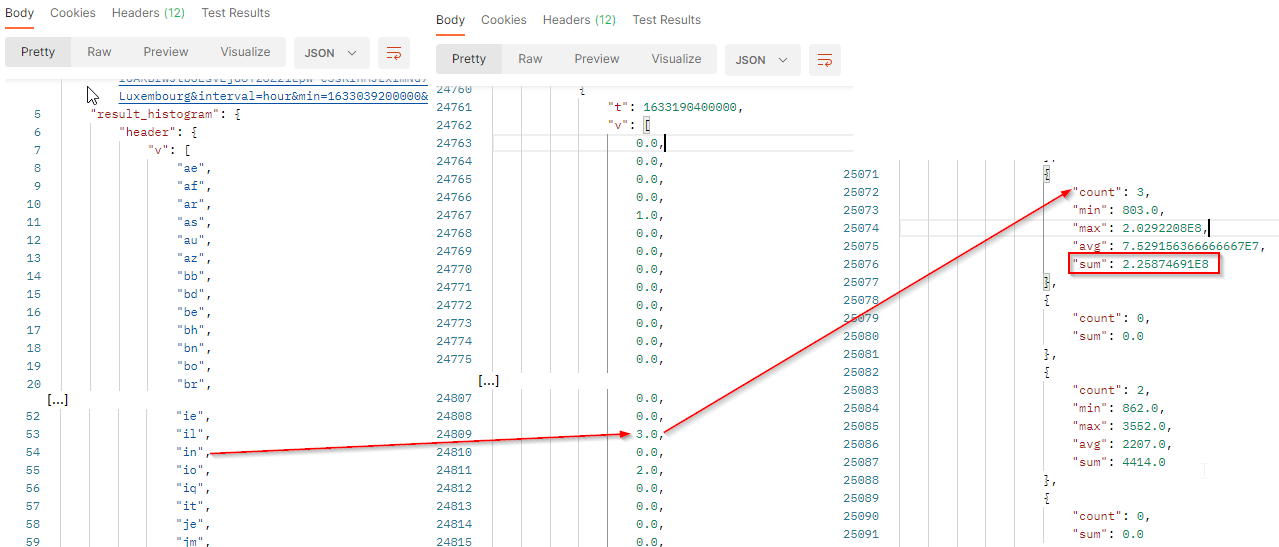
The result will come with a header row which provides the country codes of the returned values. The order of the values respects the order of the header.
The result is a bidimensional array where v is the results (number of documents) per country code and val contains potential reach values to build the histogram.
In our sample :
tis the timestamp (here 1633190400000 represents October 2, 2021 06:00:00 PM GMT+02:00).vis the number of documents which match the filter criterias at this date.valcontains the value to build histogram:
countis the number of documents which match the filter criterias at this date. It corresponds to the results.minis the minimum potential reach generated by the documents which match the filter criterias at this date.maxis the maximum potential reach generated by the documents which match the filter criterias at this date.avgis the average of potential reach generated by the documents which match the filter criterias at this date. It’s the sum / count.sumis the total potential reach generated by the documents which match the filter criterias at this date. At this date, published documents from India potentially reach 225,874,691 peoples.
Engagement split
This diagram shows the total engagement generated by the documents which match your query on a specific date/time by media types:
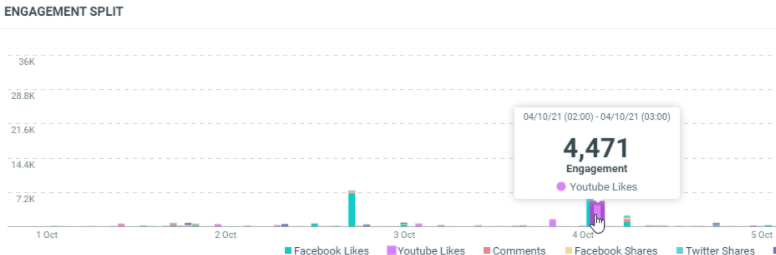
In this sample, the 04th of October, 2h (Europe/Luxembourg time zone), we have got 4471 Youtube likes on the documents which were published.
WARNING: By API, it’s not possible to get all metrics in one call.
To retrieve this result, we can combine the published histogram with the parameter value_type setted to the metric you want to retrieve. It can be one of these metrics: facebook_shares, facebook_likes, twitter_retweets, twitter_shares, twitter_likes, twitter_followers, instagram_likes, youtube_views, youtube_likes, youtube_dislikes or comment_count.
curl -L -X GET 'https://api.talkwalker.com/api/v1/search/p/<project_id>/histogram/published?access_token=<access_token>&value_type=youtube_likes&timezone=Europe/Luxembourg&interval=hour&min=1633039200000&max=1633644000000'
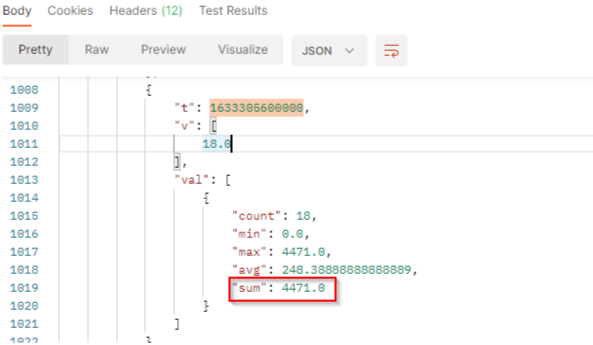
In our sample :
tis the timestamp (here 1633305600000 represents October 4, 2021 02:00:00 AM GMT+02:00).vis the number of documents which match the filter criterias at this date.valcontains the value to build histogram:
countis the number of documents which match the filter criterias at this date. It corresponds to the results.minis the minimum number of youtube likes generated by the documents which match the filter criterias at this date.maxis the maximum number of youtube likes generated by the documents which match the filter criterias at this date.avgis the average number of youtube likes generated by the documents which match the filter criterias at this date. It’s the sum / count.sumis the total number of youtube likes generated by the documents which match the filter criterias at this date. At this date, we got 4471 youtube likes.
Reach VS Engagement
This diagram shows the total engagement and the potential reach generated by the documents which match your topic within the filtered period:
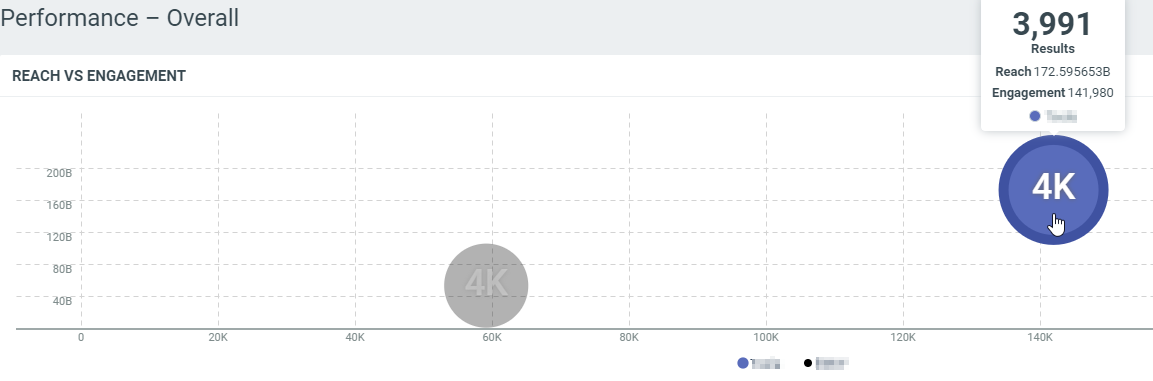
In this sample, over the filtered period (between the 1st of October and the 8th of october), for the topic in blue we got a total engagement of 141980 and 172.59 Billions of potential reaches.
- X-absis: The total engagement
- Y-absis: The total engagement
By API, it’s not possible to get it in one call. You have to call 2 histograms for each topic.
To retrieve this result, we can use both reach and engagement histogram with the highest interval value to get only the total number over the period. The topic needs to be specified:
For the engagement
curl -L -X GET 'https://api.talkwalker.com/api/v1/search/p/<project_id>/histogram/engagement?access_token=<access_token>&topic=<topic_id>&q=published:>1633039200000 AND published:<1633644000000&interval=40000'
For the potential reach
curl -L -X GET 'https://api.talkwalker.com/api/v1/search/p/<project_id>/histogram/reach?access_token=<access_token>&topic=topic_id&q=published:>1633039200000 AND published:<1633644000000&interval=1200000000'
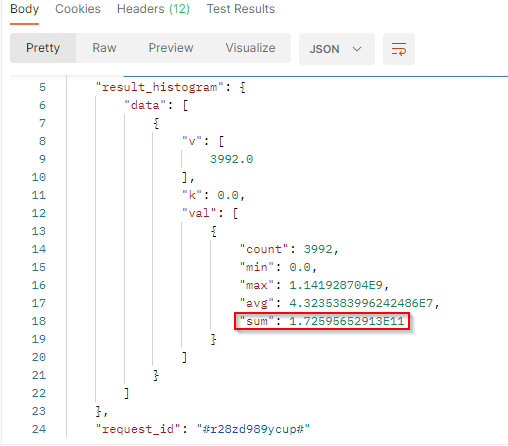
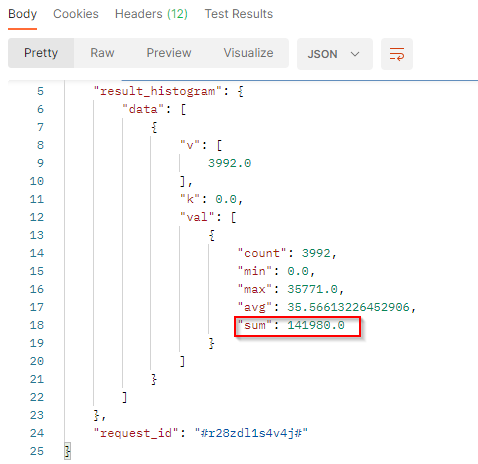
In our sample :
vis the number of documents which match the filter criterias in the filtered period. we got 3994 documents in the period.kis the number-based lower bound of the current bucket. The buchet bounds depend on the interval.valcontains the value to build histogram:
countis the number of documents which match the topic in the interval. It corresponds to the results.minis the minimum engagement or potential reach (depends on the endpoint) generated by the documents which match the topic in the interval.maxis the maximum engagement or potential reach (depends on the endpoint generated by the documents which match the topic in the interval.avgis the average of engagement or potential reach (depends on the endpoint generated by the documents which match the topic in the interval. It’s the sum / count.sumis the total engagement or potential reach (depends on the endpoint generated by the documents which match the topic in the interval. In these 2 resultset, we got a total engagement of 141,980 and a total potential reach of 172.595652913 Billion.
Share of Topics
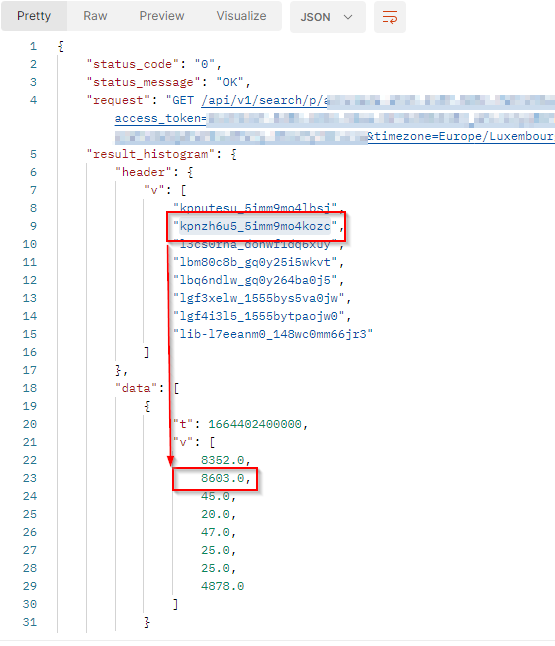
This diagram shows the total number of documents by topic within the filtered period:
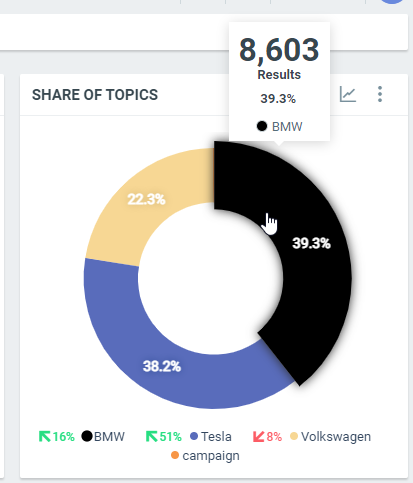
In this sample, over the filtered period (between the 1st of October and the 8th of October), we got 8603 documents indexed in the topic BMW, which represents 39.3% of the total results within the filtered period.
To retrieve this result, we can use the published histogram breakdown by topic with the highest interval value to get only the total number over the period:
curl -L -X GET 'https://api.talkwalker.com/api/v1/search/p/<project_id>/histogram/published?access_token=<access_token>&timezone=Europe/Luxembourg&interval=2w&min=1664575200000&max=1665266400000&breakdown=topic'
If the data is spread over 2 weeks, months, quarter or years, you will get 2 results, one per period. You need to double it to get only one result (eg: if it spreads over 2 years, use the interval 720d).
The result will come with a header row which provides the legend of the returned values. The order of the values respects the order of the header.
The API returned the topics' ID, not the name. To retrieve the name, please refer to the topic API guide.
In our sample :
- The topic "BMW" has the ID
kpnzh6u5_5imm9mo4kozc. tis the timestamp (beginning of the period).vis the array of number of published documents which match the filter criteria at this date. It comes as a list where each value represents 1 topic. For the topic BMW (IDkpnzh6u5_5imm9mo4kozc, we got 8603 documents at this date.
Share of engagement
Share of engagement by Media Types
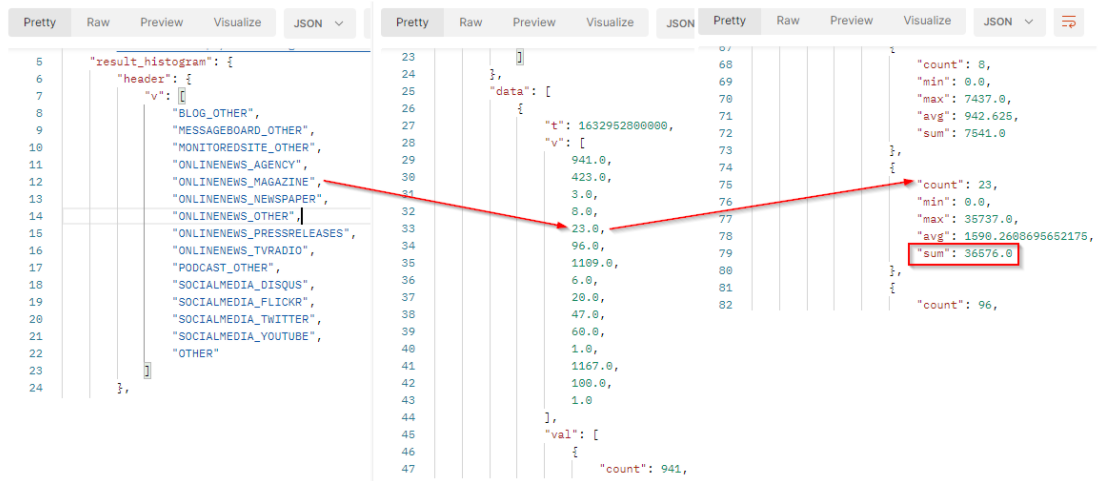
This diagram shows the total engagement of the documents by media types within the filtered period:
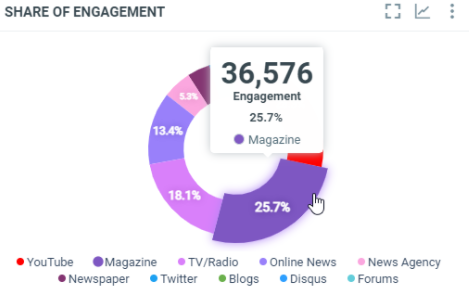
In this sample, over the filtered period (between the 1st of October and the 8th of october), we got a total engagement of 36575 from the Magazine documents, which represents 25.7% of the total engagement within the filtered period.
To retrieve this result, we can use published histogram breakdown by source types combined with the engagement values (value_type parameter), with the highest interval value to get only the total number over the period:
curl -L -X GET 'https://api.talkwalker.com/api/v1/search/p/<project_id>/histogram/published?access_token=<access_token>&value_type=engagement&timezone=Europe/Luxembourg&interval=2w&min=1633039200000&max=1633644000000&breakdown=sourcetype'
The result will come with a header row which provides the legend of the returned values. The order of the values respects the order of the header.
The result is a bidimensional array where v is the results (number of documents) per Media type and val contains engagement values to build the histogram.
In our sample :
tis the timestamp (beginning of the period).vis the array of number of published documents which match the filter criterias in the filtered period. It comes as a list where each value represents 1 source type. From Magazines, we got 23 documents in the period.valcontains the value to build histogram:
countis the number of documents which match the filter criterias at this date. It corresponds to the results.minis the minimum engagement generated by the documents which match the filter criterias.maxis the maximum engagement generated by the documents which match the filter criterias.avgis the average of engagement generated by the documents which match the filter criterias. It’s the sum / count.sumis the total engagement generated by the documents which match the filter criterias at this date. From Magazines, we got a total engagement of 36576 in this period.
Share of engagement by Sentiments
This diagram shows the total engagement of the documents by sentiment within the filtered period:
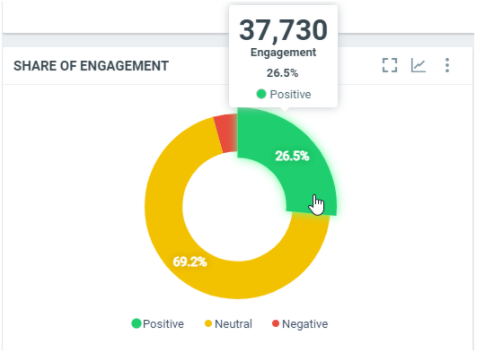
In this sample, over the filtered period (between the 1st of October and the 8th of october), we got a total engagement of 37730 from the documents with a positive sentiment, which represents 26.5% of the total engagement within the filtered period.
To retrieve this result, we can use published histogram breakdown by sentiment combined with the engagement values (value_type parameter), with the highest interval value to get only the total number over the period:
curl -L -X GET 'https://api.talkwalker.com/api/v1/search/p/<project_id>/histogram/published?access_token=<access_token>&value_type=engagement&timezone=Europe/Luxembourg&interval=2w&min=1633039200000&max=1633644000000&breakdown=sentiment
If the data is spread over 2 weeks, months, quarter or years, you will get 2 results, one per period. You need to double it to get only one result (eg: if it spreads over 2 years, use the interval 720d).
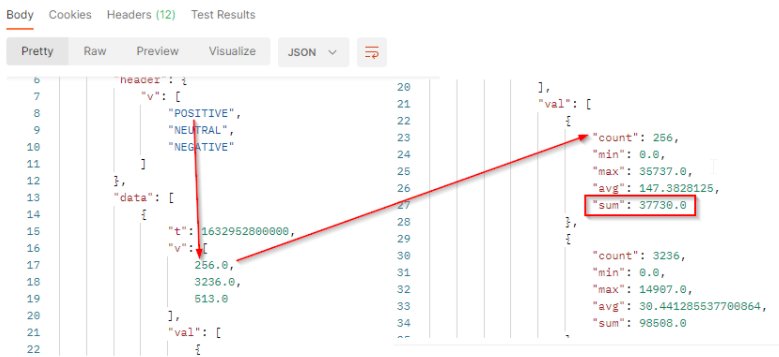
The result will come with a header row which provides the legend of the returned values. It’s always the 3 values POSITIVE, NEUTRAL and NEGATIVE. The order of the values respects the order of the header.
The result is a bidimensional array where v is the results (number of documents) per sentiment and val contains engagement values to build the histogram.
In our sample :
tis the timestamp (beginning of the period).vis the array of number of published documents which match the filter criterias in the filtered period. It comes as a list where each value represents 1 sentiment. We got 256 positive documents in the period.valcontains the value to build histogram:
countis the number of documents which match the filter criterias and sentiment at this date. It corresponds to the results.minis the minimum engagement generated by the documents which match the sentiment and the filter criterias.maxis the maximum engagement generated by the documents which match the sentiment and the filter criterias.avgis the average of engagement generated by the documents which match the sentiment and the filter criterias. It’s the sum / count.sumis the total engagement generated by the documents which match the sentiment and the filter criterias at this date. We got a total engagement of 37730 from positive documents in this period.
Share of engagement by Countries
This diagram shows the total engagement of the documents by country within the filtered period:
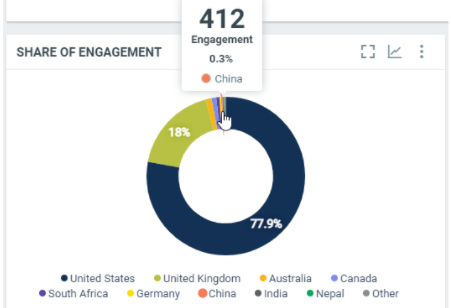
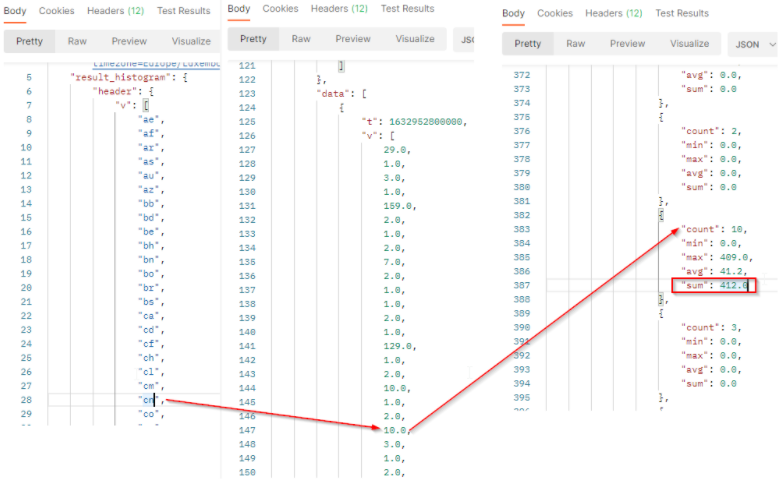
In this sample, over the filtered period (between the 1st of October and the 8th of october), we got a total engagement of 412 from the documents published in China, which represents 0.3% of the total engagement within the filtered period.
To retrieve this result, we can use published histogram breakdown by country combined with the engagement values (value_type parameter), with the highest interval value to get only the total number over the period:
curl -L -X GET 'https://api.talkwalker.com/api/v1/search/p/<project_id>/histogram/published?access_token=<access_token>&value_type=engagement&timezone=Europe/Luxembourg&interval=2w&min=1633039200000&max=1633644000000&breakdown=country
If the data is spread over 2 weeks, months, quarter or years, you will get 2 results, one per period. You need to double it to get only one result (eg: if it spreads over 2 years, use the interval 720d).
The result will come with a header row which provides the legend of the returned values. The order of the values respects the order of the header.
The result is a bidimensional array where v is the results (number of documents) per country and val contains engagement values to build the histogram.
In our sample :
tis the timestamp (beginning of the period).vis the array of number of published documents which match the filter criterias in the filtered period. It comes as a list where each value represents 1 country. We got 10 documents from China in the period.valcontains the value to build histogram:
countis the number of documents which match the filter criterias and country code at this date. It corresponds to the results.minis the minimum engagement generated by the documents which match the country code and the filter criterias.maxis the maximum engagement generated by the documents which match the country code and the filter criterias.avgis the average of engagement generated by the documents which match the country code and the filter criterias. It’s the sum / count.sumis the total engagement generated by the documents which match the country code and the filter criterias at this date. We got a total engagement of 412 from China in this period.
Share of reach
Share of reach by Media Types
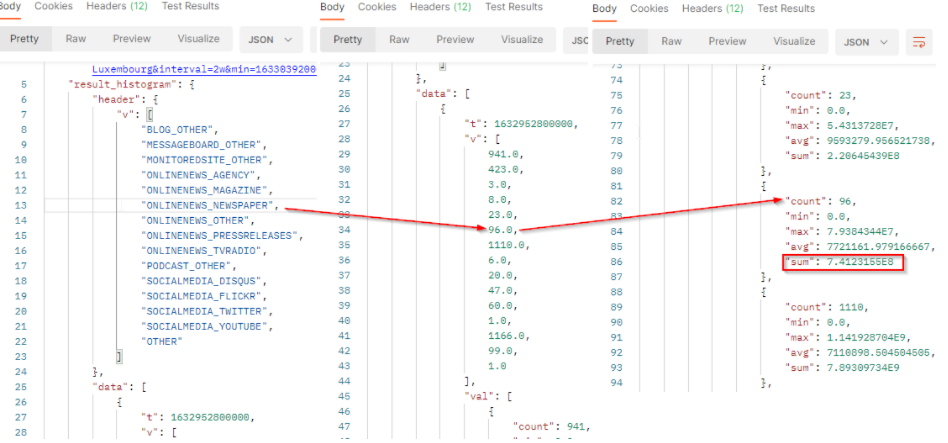
This diagram shows the total number of people who were reached by the documents splitted by media types within the filtered period:
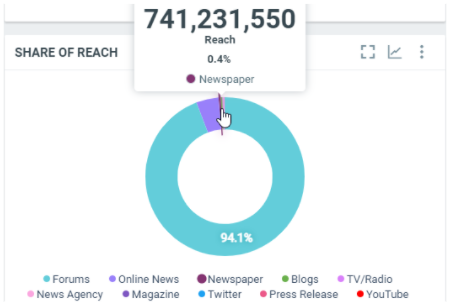
In this sample, over the filtered period (between the 1st of October and the 8th of october), we got 741,231,550 people reached by the Newspaper documents, which represents 0.4% of the total potential reach within the filtered period.
To retrieve this result, we can use published histogram breakdown by source types combined with the reach values (value_type parameter), with the highest interval value to get only the total number over the period:
curl -L -X GET 'https://api.talkwalker.com/api/v1/search/p/<project_id>/histogram/published?access_token=<access_token>&value_type=reach&timezone=Europe/Luxembourg&interval=2w&min=1633039200000&max=1633644000000&breakdown=sourcetype'
If the data is spread over 2 weeks, months, quarter or years, you will get 2 results, one per period. You need to double it to get only one result (eg: if it spreads over 2 years, use the interval 720d).
The result will come with a header row which provides the legend of the returned values. The order of the values respects the order of the header.
The result is a bidimensional array where v is the results (number of documents) per Media type and val contains the reach values to build the histogram.
In our sample :
tis the timestamp (beginning of the period).vis the array of number of published documents which match the filter criterias in the filtered period. It comes as a list where each value represents 1 source type. From Newspaper, we got 96 documents in the period.valcontains the value to build histogram:
countis the number of documents which match the filter criterias. It corresponds to the results.minis the minimum engagement generated by the documents which match the filter criterias.maxis the maximum engagement generated by the documents which match the filter criterias.avgis the average of engagement generated by the documents which match the filter criterias. It’s the sum / count.sumis the total engagement generated by the documents which match the filter criterias at this date. From Magazines, we potentially reach 741,231,550 people in this period.
Share of reach by Sentiments
This diagram shows the the total number of people that were reached by the documents splitted by sentiments within the filtered period:
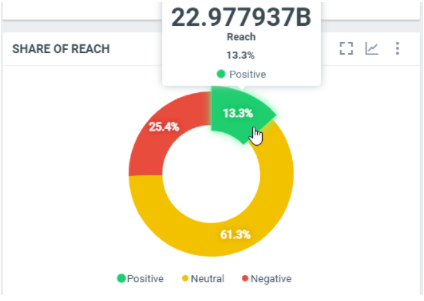
In this sample, over the filtered period (between the 1st of October and the 8th of october), we got 22.977937 billions persons reached by the documents with a positive sentiment, which represents 13.3% of the total potential reach within the filtered period.
To retrieve this result, we can use published histogram breakdown by sentiments combined with the reach values (value_type parameter), with the highest interval value to get only the total number over the period:
curl -L -X GET 'https://api.talkwalker.com/api/v1/search/p/<project_id>/histogram/published?access_token=<access_token>&value_type=reach&timezone=Europe/Luxembourg&interval=2w&min=1633039200000&max=1633644000000&breakdown=sentiment
If the data is spread over 2 weeks, months, quarter or years, you will get 2 results, one per period. You need to double it to get only one result (eg: if it spreads over 2 years, use the interval 720d).
The result will come with a header row which provides the legend of the returned values. It’s always the 3 values POSITIVE, NEUTRAL and NEGATIVE. The order of the values respects the order of the header.
The result is a bidimensional array where v is the results (number of documents) per sentiment and val contains the reach values to build the histogram.
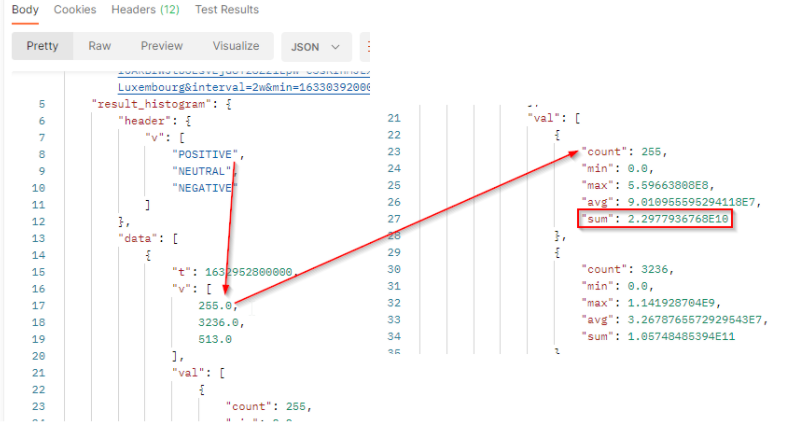
In our sample :
tis the timestamp (beginning of the period).vis the array of number of published documents which match the filter criterias in the filtered period. It comes as a list where each value represents 1 sentiment. From Newspaper, we got 255 documents with a positive sentiment in the period.valcontains the value to build histogram:
countis the number of documents which match the filter criterias and sentiment. It corresponds to the results.minis the minimum engagement generated by the documents which match the filter criterias and sentiment.maxis the maximum engagement generated by the documents which match the filter criterias and sentiment.avgis the average of engagement generated by the documents which match the filter criterias and sentiment. It’s the sum / count.sumis the total engagement generated by the documents which match the filter criterias and sentiment at this date. From documents with a positive sentiment, we potentially reach 22,977,936,768 people in this period.
Share of reach by Countries
This diagram shows the total number of people that were reached by the documents splitted by countries within the filtered period:
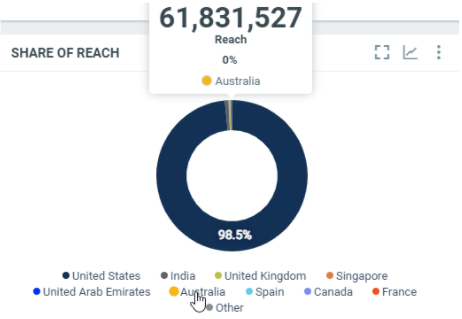
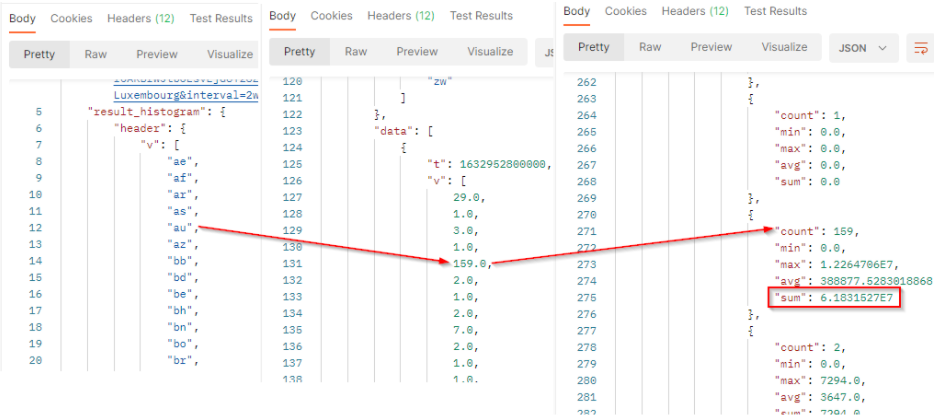
In this sample, over the filtered period (between the 1st of October and the 8th of october), we got 64,831,527 people reached by the documents from Australia.
To retrieve this result, we can use published histogram breakdown by countries combined with the reach values (value_type parameter), with the highest interval value to get only the total number over the period:
curl -L -X GET 'https://api.talkwalker.com/api/v1/search/p/<project_id>/histogram/published?access_token=<access_token>&value_type=reach&timezone=Europe/Luxembourg&interval=2w&min=1633039200000&max=1633644000000&breakdown=country
If the data is spread over 2 weeks, months, quarter or years, you will get 2 results, one per period. You need to double it to get only one result (eg: if it spreads over 2 years, use the interval 720d).
The result will come with a header row which provides the legend of the returned values. The order of the values respects the order of the header.
The result is a bidimensional array where v is the results (number of documents) per Media type and val contains the reach values to build the histogram.
In our sample :
tis the timestamp (beginning of the period).vis the array of number of published documents which match the filter criterias in the filtered period. It comes as a list where each value represents 1 country code. From Australia, we got 159 documents in the period.valcontains the value to build histogram:
countis the number of documents which match the filter criterias and the country code. It corresponds to the results.minis the minimum engagement generated by the documents which match the filter criterias and the country code.maxis the maximum engagement generated by the documents which match the filter criterias and the country code.avgis the average of engagement generated by the documents which match the filter criterias and the country code. It’s the sum / count.sumis the total engagement generated by the documents which match the filter criterias at this date. From Australia (country code “au”), we potentially reach 61,831,527 people in this period.