Results
Result over time
Global usage without comparison
This diagram shows the number total of documents which match your query on a specific date/time:
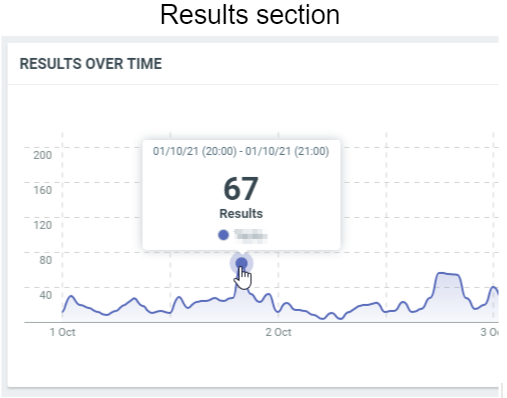
In this sample, these are the results for 7 days with an interval of 1 hour. The 1st of October, 20h (Europe/Luxembourg time zone), we have 67 documents which were published.
To retrieve this result, we can use the following API request:
curl -X GET 'https://api.talkwalker.com/api/v1/search/p/<project_id>/histogram/published?access_token=<access_token>&timezone=Europe/Luxembourg&interval=hour'
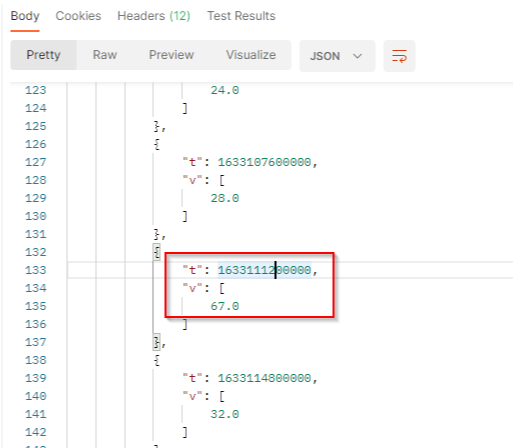
With:
tis the timestamp (here1633111200000represents October 1, 2021 8:00:00 PM GMT+02:00).vis the number of published documents which match the filter criterias at this date.
The parameter timezone works only for the histograms of type published and search_indexed.
By default, like the UI, if no dates are specified, the API returns the last 7 days. You can change the range by using parameters “min” and “max” with timestamp.
To query the full month of September 2021 :
curl -X GET 'https://api.talkwalker.com/api/v1/search/p/<project_id>/histogram/published?access_token=<access_token>&timezone=Europe/Luxembourg&interval=day&min=1630447200000&max=1631224800000
Results over time by Topics
This diagram shows the number of documents which match your query on a specific date/time splitted by topics:
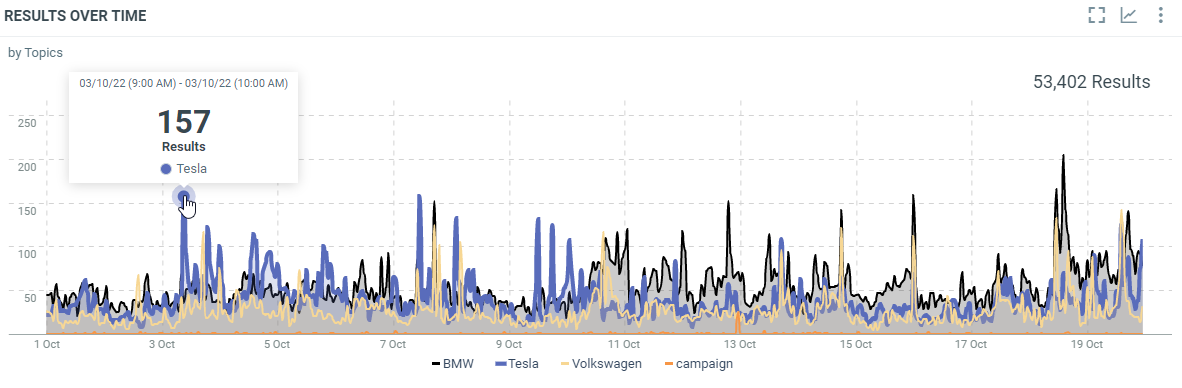
In this sample, the 3rd of October, 9h (Europe/Luxembourg time zone), we have 157 documents which were published and indexed in the topic "Tesla".
To retrieve this result, we can use the same endpoint as the histogram Result over time with the additional parameter breakdown:
curl -X GET 'https://api.talkwalker.com/api/v1/search/p/<project_id>/histogram/published?access_token=<access_token>&breakdown=topic&timezone=Europe/Luxembourg&interval=hour'
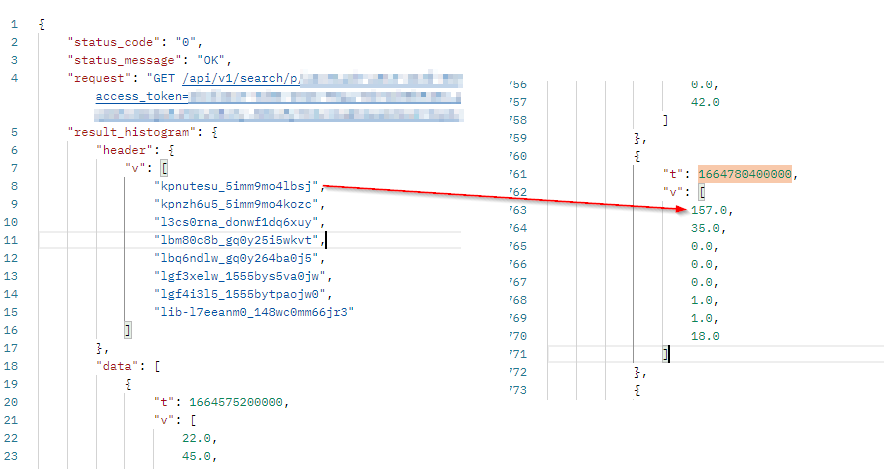
The result will come with a header row which provides the legend of the returned values. The order of the values respects the order of the header.
The API returned the topics' ID, not the name. To retrieve the name, please refer to the topic API guide.
In our sample :
- The topic "Tesla" has the ID
kpnutesu_5imm9mo4lbsj. tis the timestamp (here1664780400000represents October 3, 2022 7:00:00 AM GMT+02:00).vis the array of number of published documents which match the filter criterias at this date. It comes as a list where each value represents 1 topic. For the topic Tesla (IDkpnutesu_5imm9mo4lbsj, we got 157 documents at this date.
Results over time by Media Types
This diagram shows the number of documents which match your query on a specific date/time splitted by media types:
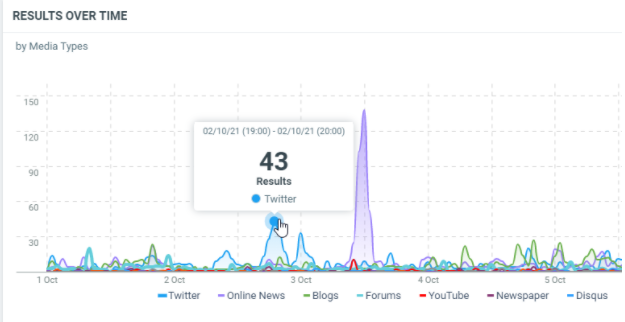
In this sample, the 1st of October, 19h (Europe/Luxembourg time zone), we have 43 documents which were published from Twitter.
To retrieve this result, we can use the same endpoint as the histogram Result over time with the additional parameter breakdown:
curl -X GET 'https://api.talkwalker.com/api/v1/search/p/<project_id>/histogram/published?access_token=<access_token>&breakdown=sourcetype&timezone=Europe/Luxembourg&interval=hour'
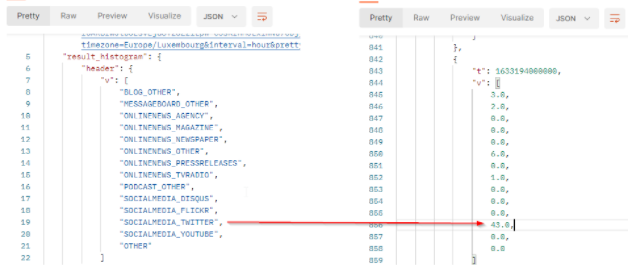
The result will come with a header row which provides the legend of the returned values. The order of the values respects the order of the header. In our sample :
tis the timestamp (here1633194000000represents October 2, 2021 7:00:00 PM GMT+02:00).vis the array of number of published documents which match the filter criterias at this date. It comes as a list where each value represents 1 source type. From Twitter, we got 43 documents at this date.
Results over time by Sentiments
This diagram shows the number of documents which match your query on a specific date/time splitted by sentiments:
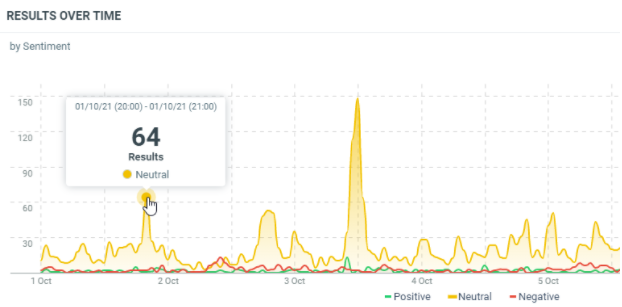
In this sample, these are the results on the last 7 days with an interval of 1 hour per results. We add a breakdown on the sentiments. The 1st of October, 20h (Europe/Luxembourg time zone), we have 64 documents which were published with a neutral sentiment.
To retrieve this result, we can use the same endpoint as the histogram Result over time with the additional parameter breakdown:
curl -X GET 'https://api.talkwalker.com/api/v1/search/p/<project_id>/histogram/published?access_token=<access_token>&breakdown=sentiment&timezone=Europe/Luxembourg&interval=hour'
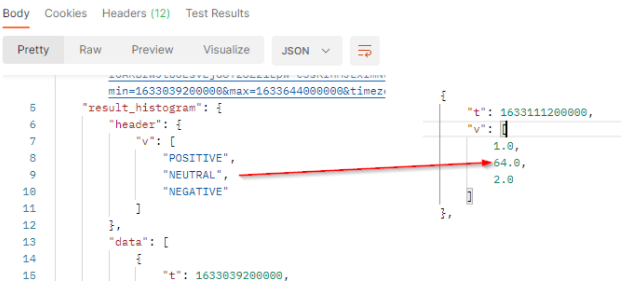
The result will come with a header row which provides the legend of the returned values. It’s always the 3 values POSITIVE, NEUTRAL and NEGATIVE. The order of the values respects the order of the header. In our sample :
tis the timestamp (here 1633111200000 represents October 1, 2021 8:00:00 PM GMT+02:00).vis the array of number of published documents which match the filter criterias at this date. It comes as a list where each value represents one of the three sentiments. We got 64 documents with a neutral sentiment at this date.
Results over time by countries
This diagram shows the number of documents which match your query on a specific date/time splitted by countries:
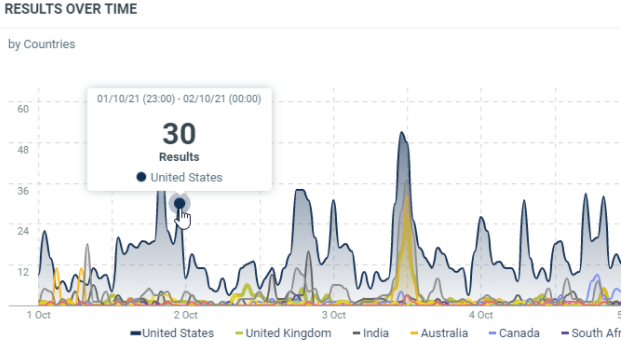
In this sample, these are the results on the last 7 days with an interval of 1 hour per results. We add a breakdown on the countries. The 01st of October, 23h (Europe/Luxembourg time zone), we have 30 documents which were published from the United States.
To retrieve this result, we can use the same endpoint as the histogram Result over time with the additional parameter breakdown:
curl -X GET 'https://api.talkwalker.com/api/v1/search/p/<project_id>/histogram/published?access_token=<access_token>&breakdown=country&timezone=Europe/Luxembourg&interval=hour'
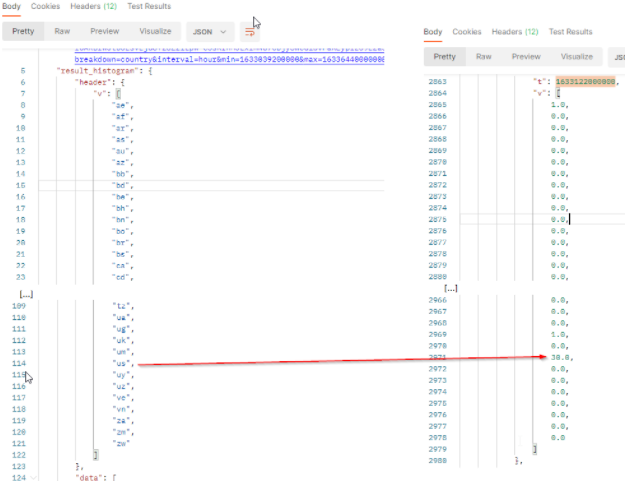
The result will come with a header row which provides the country codes of the returned values. The order of the values respects the order of the header. In our sample :
tis the timestamp (here1633122000000represents October 1, 2021 11:00:00 PM GMT+02:00).vis the array of number of published documents which match the filter criterias at this date. It comes as a list where each value represents 1 country code. From the United States (codeus), we got 30 documents at this date.
Share of Media types
This diagram shows the total number of documents by media types within the filtered period:
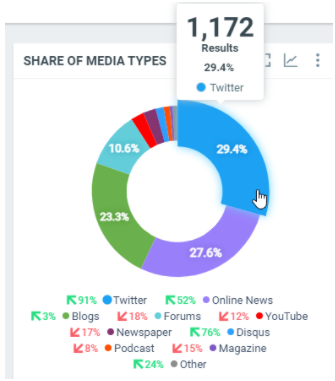
In this sample, over the filtered period (between the 1st of October and the 8th of october), we got 1172 documents posted on Twitter, which represents 29.4% of the total number of posted documents.
To retrieve this result, we can use published histogram breakdown by source types with the highest interval value to get only the total number over the period:
curl -L -X GET 'https://api.talkwalker.com/api/v1/search/p/<project_id>/histogram/published?access_token=<access_token>&breakdown=sourcetype&timezone=Europe/Luxembourg&interval=2w&min=1633039200000&max=1633644000000'
If the data is spread over 2 weeks, months, quarter or years, you will get 2 results, one per period. You need to double it to get only one result (eg: if it spreads over 2 years, use the interval 720d).
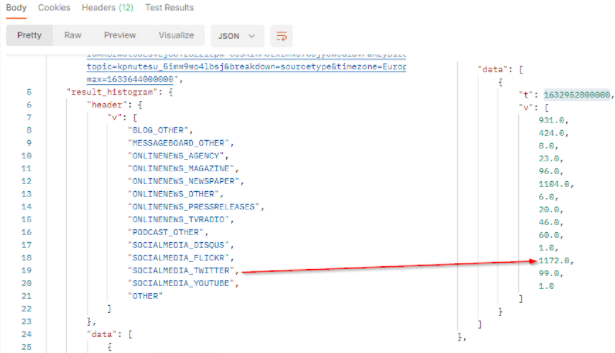
The result will come with a header row which provides the legend of the returned values. The order of the values respects the order of the header. In our sample :
tis the timestamp (beginning of the period).vis the array of number of published documents which match the filter criterias in the filtered period. It comes as a list where each value represents 1 source type. From Twitter, we got 1172 documents in the period.
Share of Sentiments
This diagram shows the total number of documents by sentiment (positive, neutral or negative) within the filtered period:
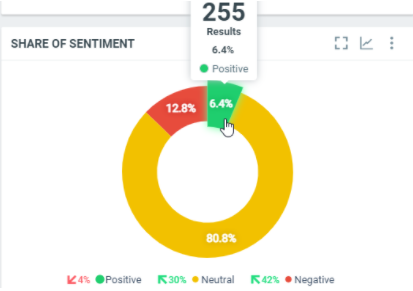
In this sample, over the filtered period (between the 1st of October and the 8th of october), we got 255 documents with a positive sentiment, which represents 6.4% of the total number of posted documents.
To retrieve this result, we can use published histogram breakdown by sentiment with the highest interval value to get only the total number over the period:
curl -L -X GET 'https://api.talkwalker.com/api/v1/search/p/<project_id>/histogram/published?access_token=<access_token>&breakdown=sentiment&timezone=Europe/Luxembourg&interval=2w&min=1633039200000&max=1633644000000'
If the data is spread over 2 weeks, months, quarter or years, you will get 2 results, one per period. You need to double it to get only one result (eg: if it spreads over 2 years, use the interval 720d).
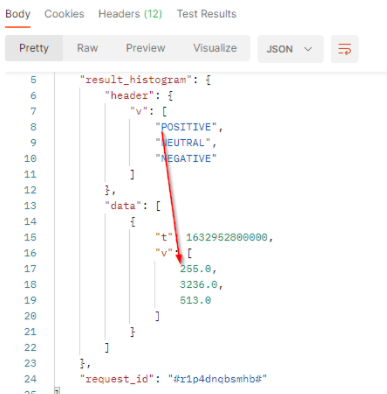
The result will come with a header row which provides the legend of the returned values. It’s always the 3 values POSITIVE, NEUTRAL and NEGATIVE. The order of the values respects the order of the header. In our sample :
tis the timestamp (beginning of the period).vis the array of number of published documents which match the filter criterias in the filtered period. It comes as a list where each value represents one of the three sentiments. We got 255 documents with a positive sentiment in this period.
Share of Countries
This diagram shows the total number of documents by country (positive, neutral or negative) within the filtered period:
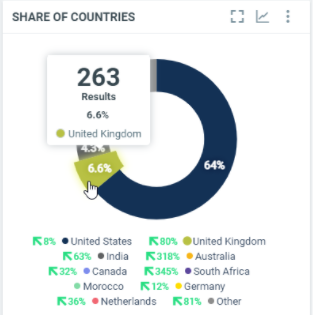
In this sample, over the filtered period (between the 1st of October and the 8th of october), we got 263 documents posted from the United Kingdom, which represents 6.6% of the total number of posted documents.
To retrieve this result, we can use published histogram breakdown by country with the highest interval value to get only the total number over the period:
curl -L -X GET 'https://api.talkwalker.com/api/v1/search/p/<project_id>/histogram/published?access_token=<access_token>&breakdown=country&timezone=Europe/Luxembourg&interval=2w&min=1633039200000&max=1633644000000'
If the data is spread over 2 weeks, months, quarter or years, you will get 2 results, one per period. You need to double it to get only one result (eg: if it spreads over 2 years, use the interval 720d).
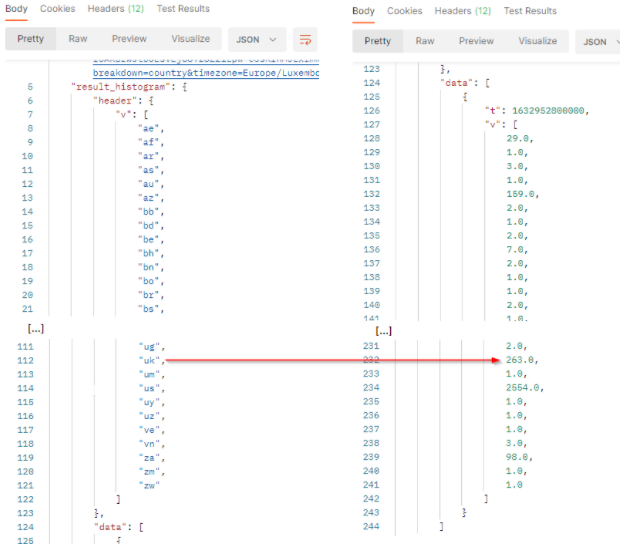
The result will come with a header row which provides the legend of the returned values. The order of the values respects the order of the header. In our sample :
tis the timestamp (beginning of the period).vis the array of number of published documents which match the filter criterias in the filtered period. It comes as a list where each value represents 1 country code. From the United Kingdom, we got 263 documents in the period.